Monthly dispensing performance
NHS prescription items and forms for every England pharmacy, with 12-month trends and month-on-month change, labelled with the NHSBSA reporting period.
Pharmacy analytics software
See how your pharmacy is performing and how you compare with the pharmacies around you. PharmacyData turns published NHS data into monthly dispensing trends, weekly EPS nomination tracking, NHS service benchmarks and competitor comparisons, with nothing to install.
From £60 per year · Public pharmacy profiles are free
10,381
England pharmacies with NHS dispensing data · July 2026
106,318,494
NHS prescription items tracked · July 2026
10,328
Pharmacies with EPS nominations · 2026-W46
NHS prescription items and forms for every England pharmacy, with 12-month trends and month-on-month change, labelled with the NHSBSA reporting period.
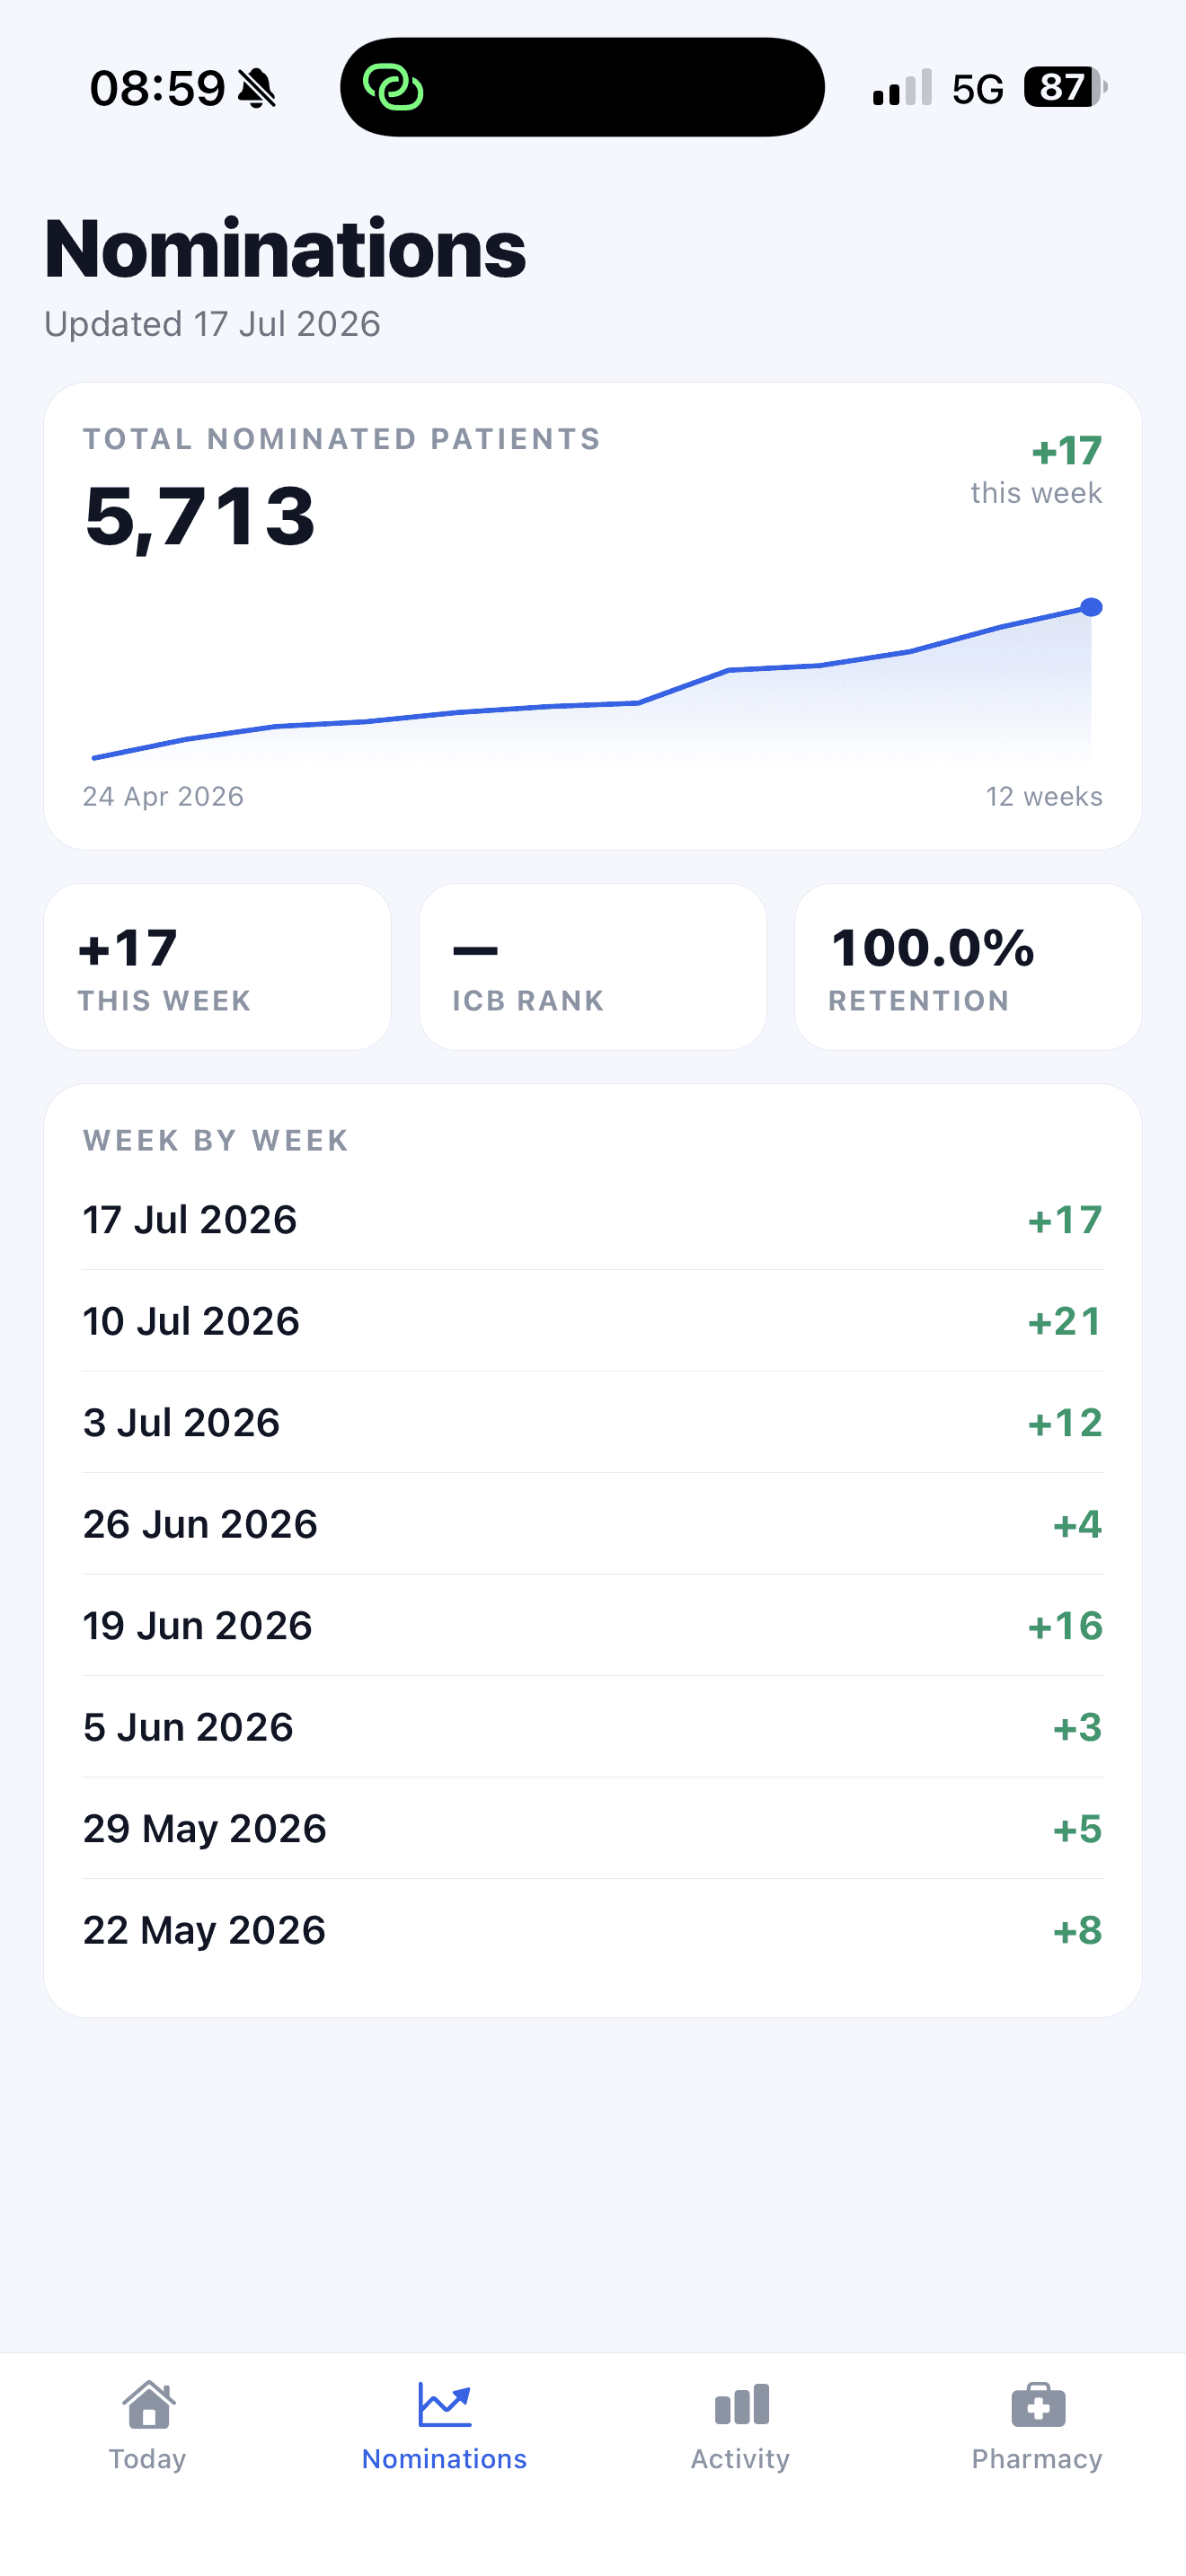
Active nominations, weekly gains and losses and your ICB rank, updated when NHS England publishes each weekly report.
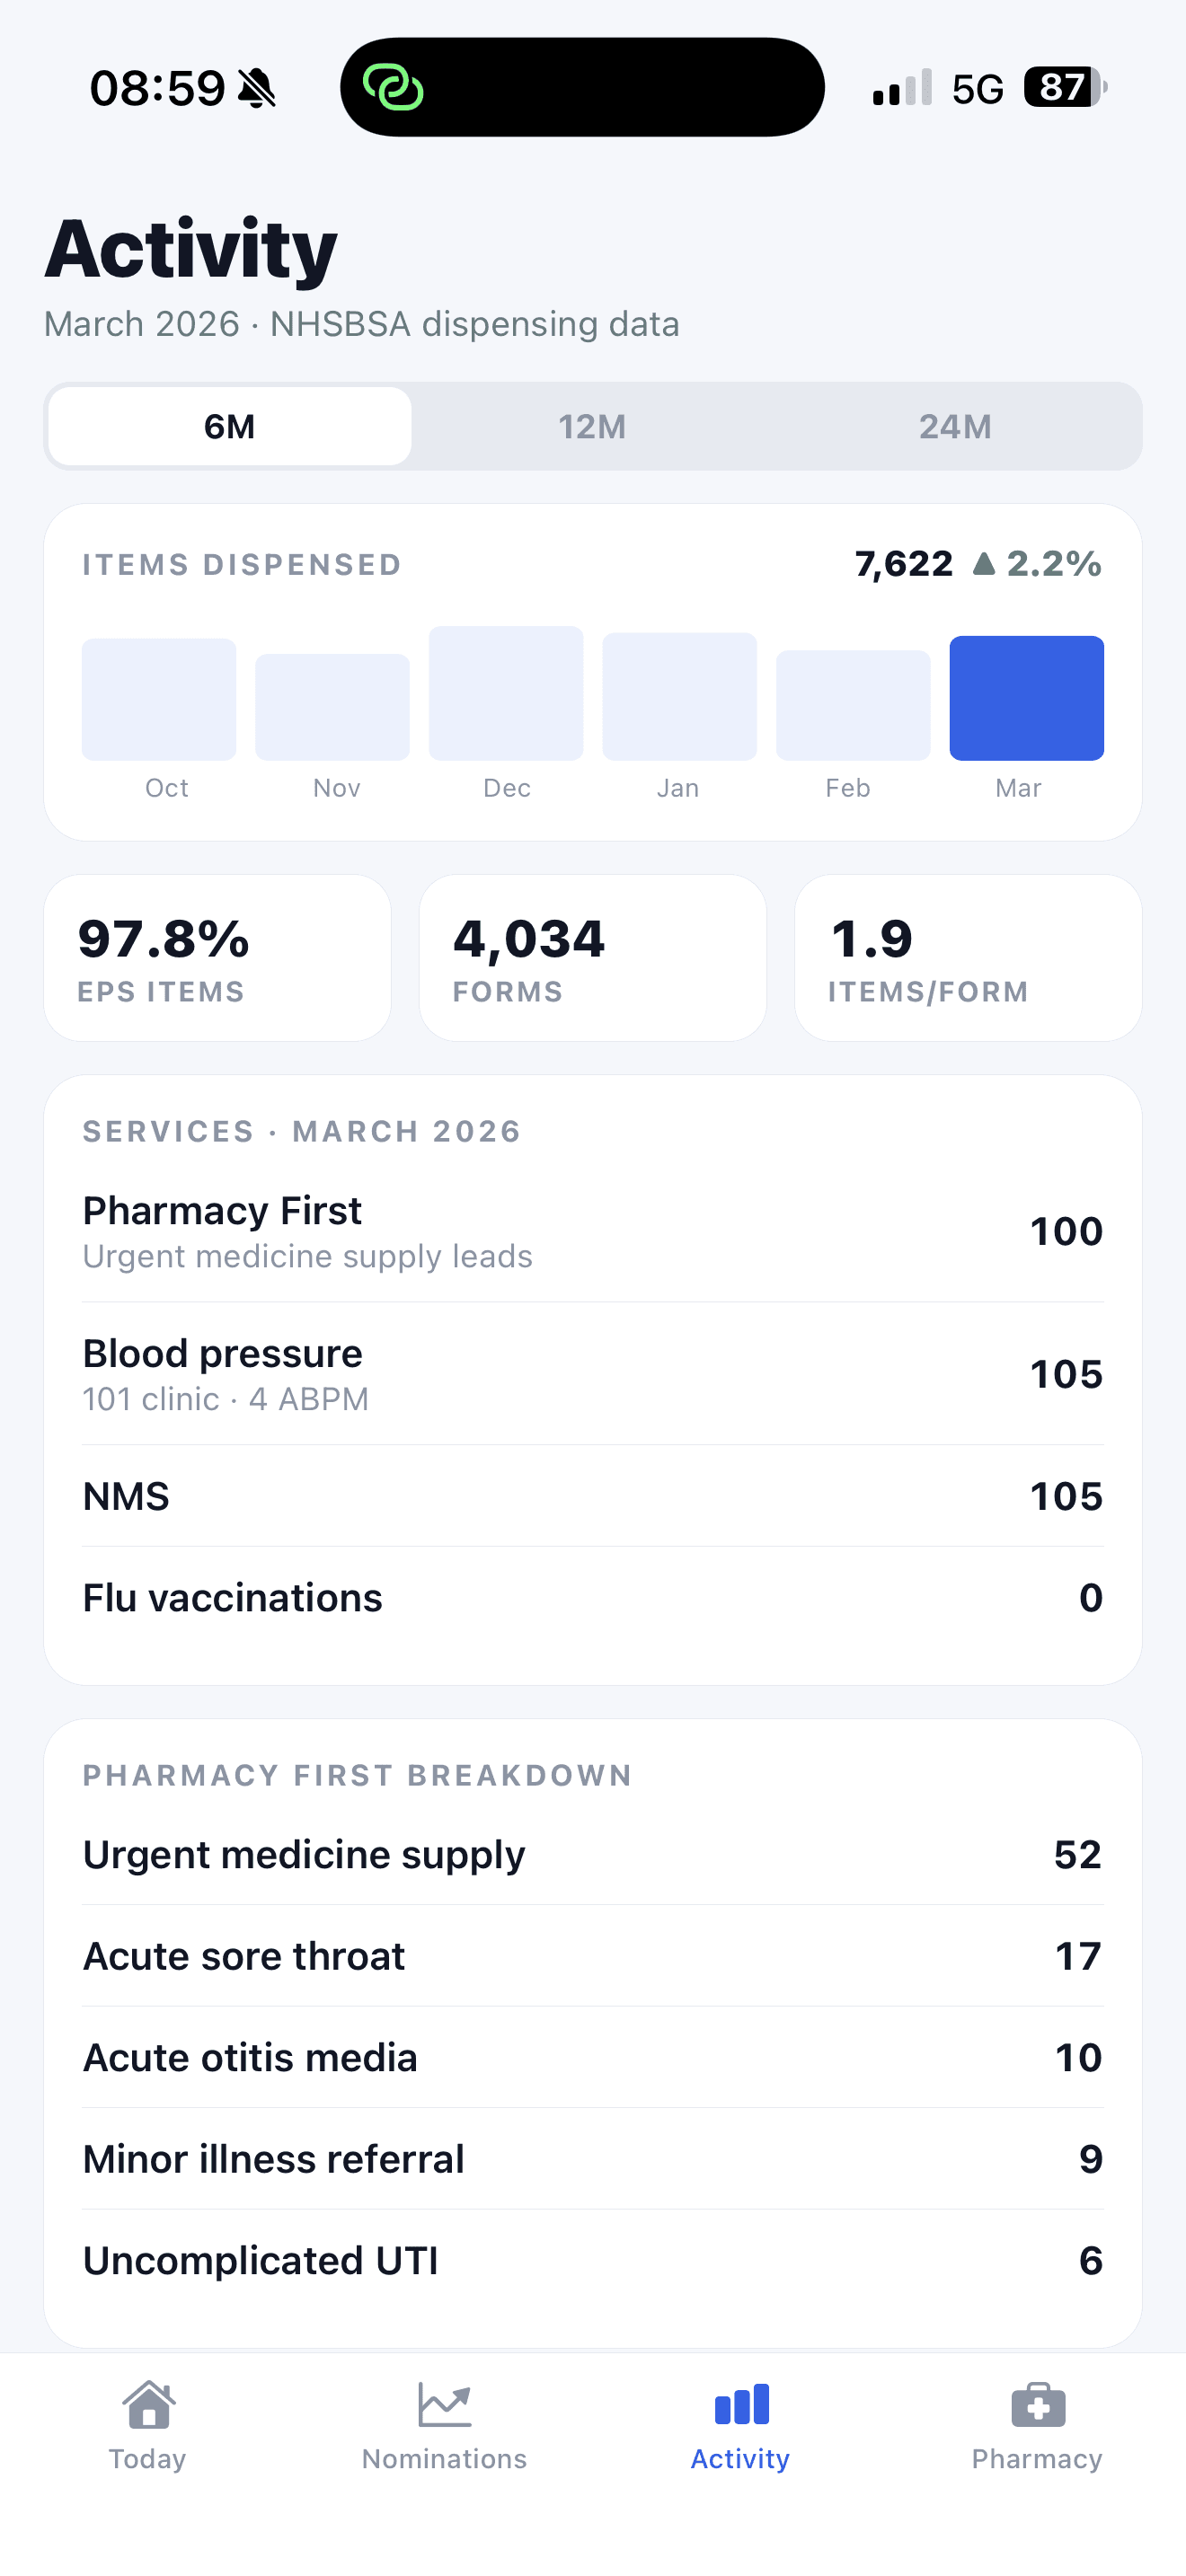
Pharmacy First, New Medicine Service, blood pressure checks, contraception and flu activity, compared with your ICB average.
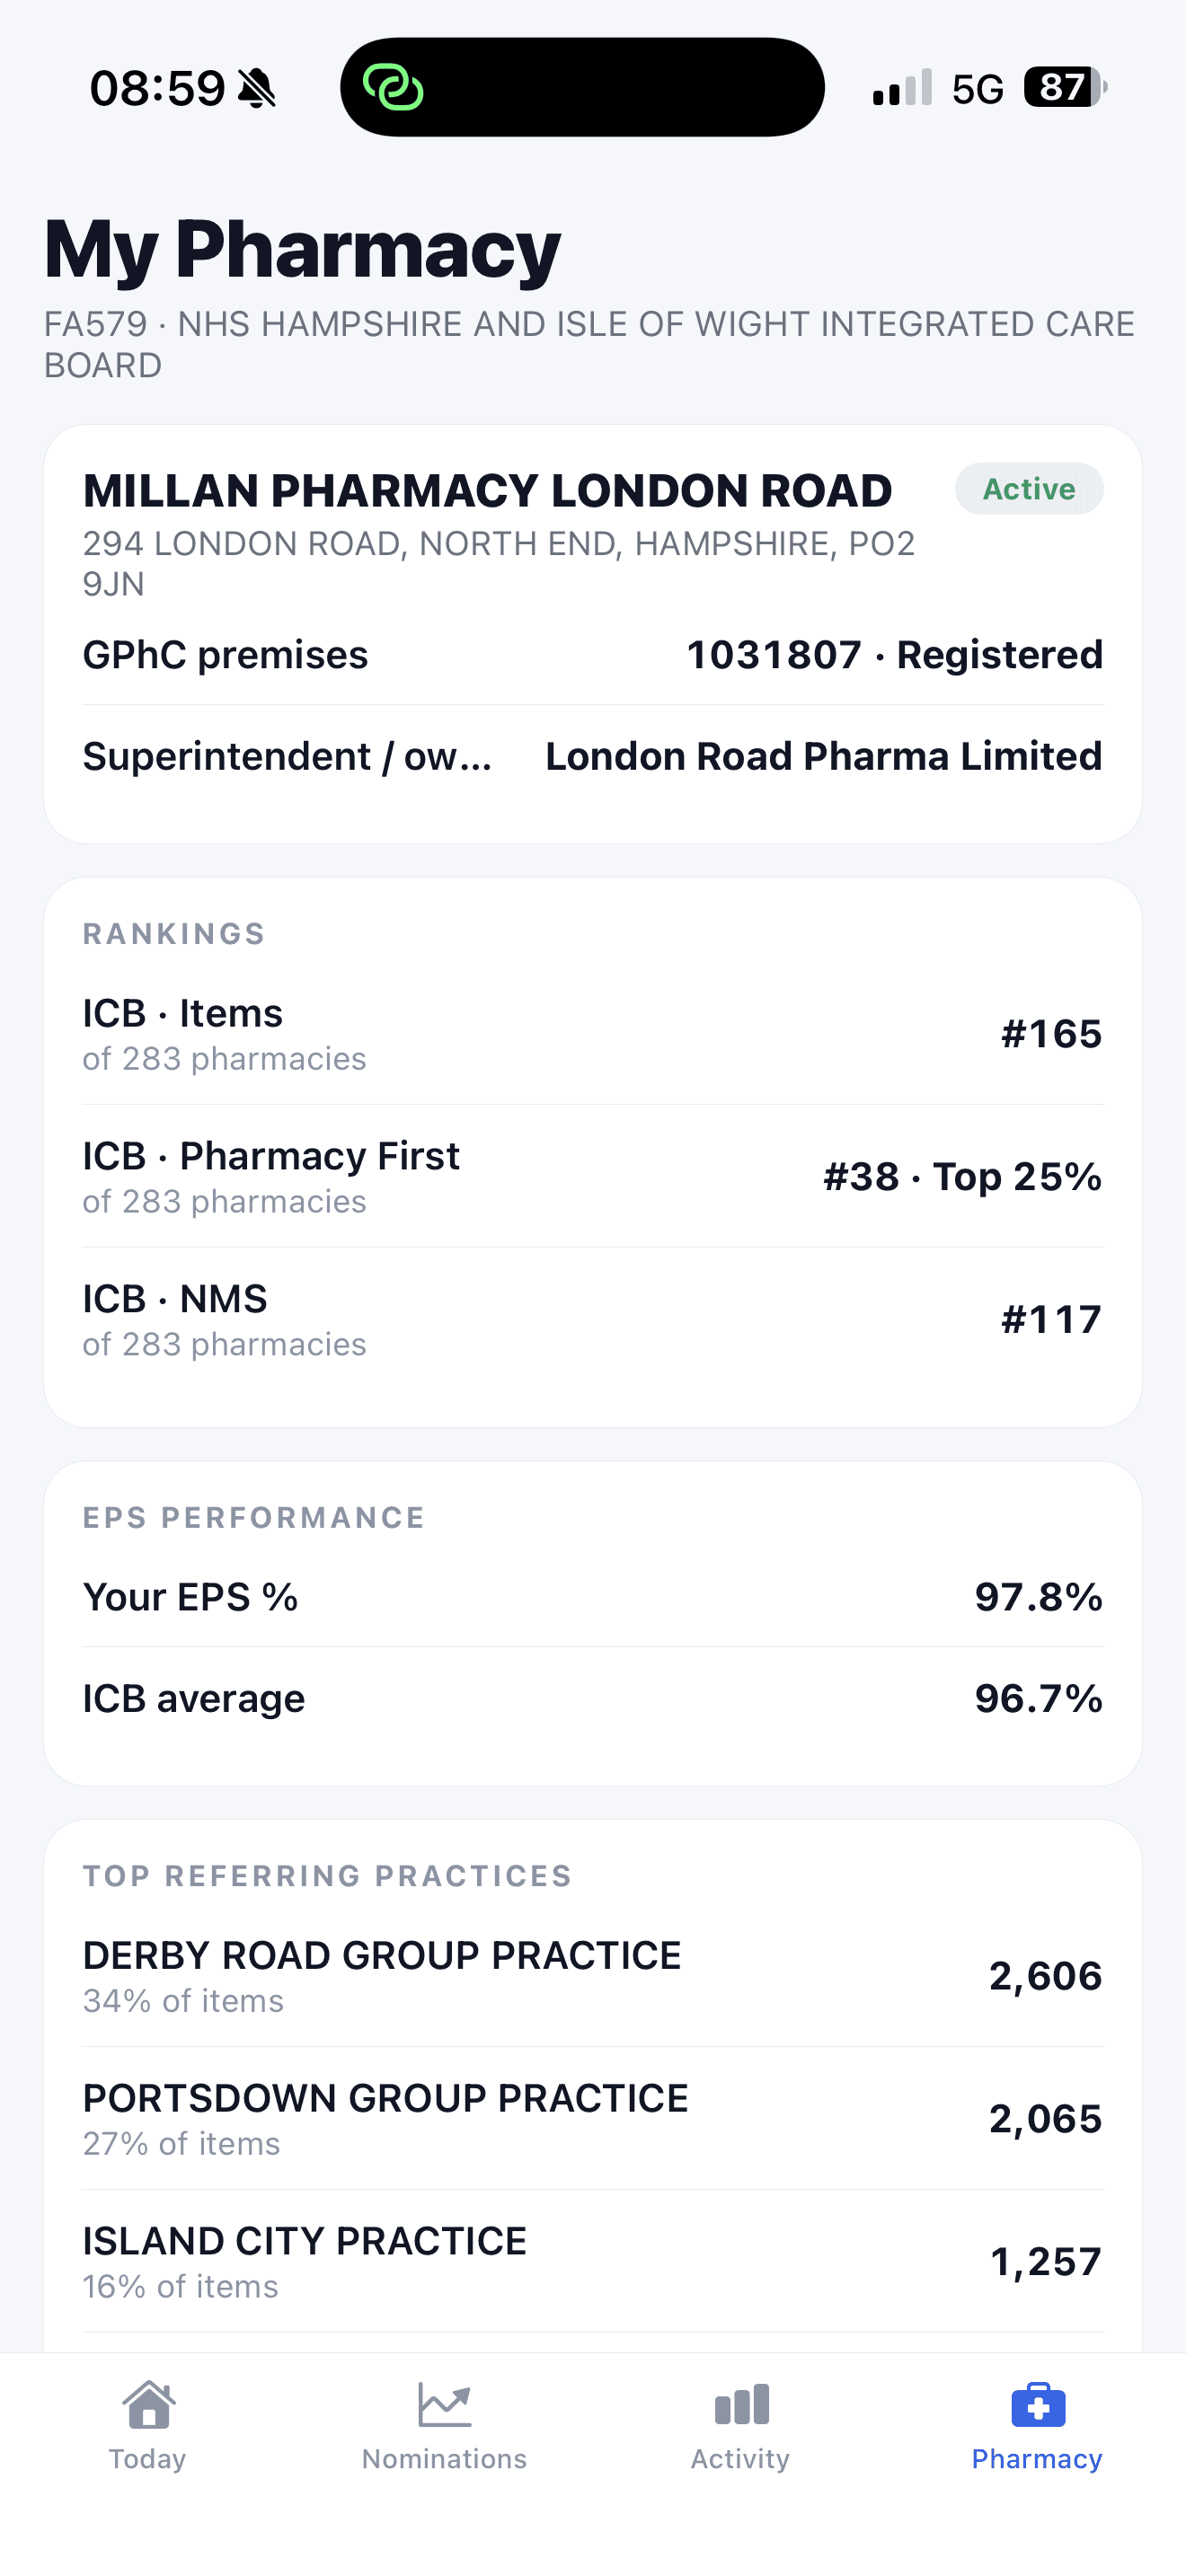
Nearby pharmacies side by side on items, nominations and services, so you can see who is growing around you.
Which GP practices' prescriptions your pharmacy and your competitors dispense, from published aggregate practice-to-pharmacy data.
PDF reports for partners and lenders, watchlists for pharmacies you track and weekly email updates on your nominations.
Track your items and nominations each month and week, spot a competitor gaining ground, and share a PDF report with partners.
Watch every branch on one set of measures and compare branches with their local markets.
Check a pharmacy's published activity trend before an acquisition, valuation or lending decision.
Size and segment the market by geography, ICB and ownership group. Custom data packs are available.
Most pharmacy software reports on your own transactions. PharmacyData is different: it benchmarks you against every other pharmacy using the same published NHS measures. Many owners use both.
| PMR / EPOS reporting | PharmacyData | |
|---|---|---|
| What it measures | Your own sales, stock and margins | Published NHS activity for you and every competitor |
| Competitor view | None: only your own till and PMR data | Every England pharmacy on the same measures |
| EPS nominations | Not usually included | Weekly, with movement and ICB rank |
| Setup | Installed on your systems | Nothing to install: search your pharmacy and go |
| Best for | Day-to-day operations | Benchmarking, growth tracking, acquisitions and reporting |
£60/year
One pharmacy owner or manager · 1 user
£120/year
A branch team sharing reports · 3 users
£180/year
Groups watching several branches · 6 users
Pharmacy analytics software turns pharmacy activity data into trends, comparisons and reports. PharmacyData uses published NHS data, so you can benchmark your pharmacy against competitors without installing anything or sharing your own systems.
Solo is £60 per year for one user. Team (£120/year) and Multi-site (£180/year) add shared access. Subscriptions renew annually and can be cancelled from your billing page.
No. PMR and EPOS systems report your own transactions. PharmacyData shows published NHS activity for every pharmacy, which is what you need to compare yourself with competitors and your ICB.
No. It uses published datasets whose release schedules vary by source. Monthly dispensing data and weekly nomination data are shown with their reporting period.
No. All figures are contractor-level or organisation-level aggregates. No patient-level data is stored or displayed.
England has the most complete coverage, including weekly EPS nominations. Scotland, Wales and Northern Ireland are covered where suitable public data exists, with nation-specific fields and timing.
Search your pharmacy to see its latest NHS items for free, then unlock nominations, services and competitor comparisons. Need a custom analysis or data pack instead? See data products.
Find your pharmacy